Just a shmankerl from the daily life of a developer.
When I tested memcp performance, I ran into the problem that my benchmark tool was too slow.
The goal was to test golang’s http server throughput in memcp. The setup is fairly easy: golangs net/http library opens up a simple http server with a custom handler. The custom handler executes a scheme script that will handle the request. When the path equals “/foo”, a handcoded query on the storage engine (indexed table scan over 9,000 items and print out of 12 result lines) is run.
I decided to use Apache’s tool ab for benchmarking.
This is the result of running ab with 1,000,000 requests:
carli@launix-MS-7C51:~/projekte/memcp$ ab -n 1000000 -c 100 http://localhost:4321/foo
This is ApacheBench, Version 2.3 <$Revision: 1879490 $>
Copyright 1996 Adam Twiss, Zeus Technology Ltd, http://www.zeustech.net/
Licensed to The Apache Software Foundation, http://www.apache.org/

Benchmarking localhost (be patient)
Completed 100000 requests
Completed 200000 requests
Completed 300000 requests
Completed 400000 requests
Completed 500000 requests
Completed 600000 requests
Completed 700000 requests
Completed 800000 requests
Completed 900000 requests
Completed 1000000 requests
Finished 1000000 requests


Server Software:
Server Hostname:        localhost
Server Port:            4321

Document Path:          /foo
Document Length:        432 bytes

Concurrency Level:      100
Time taken for tests:   31.336 seconds
Complete requests:      1000000
Failed requests:        0
Total transferred:      535000000 bytes
HTML transferred:       432000000 bytes
Requests per second:    31912.48 [#/sec] (mean)
Time per request:       3.134 [ms] (mean)
Time per request:       0.031 [ms] (mean, across all concurrent requests)
Transfer rate:          16673.02 [Kbytes/sec] received

Connection Times (ms)
              min  mean[+/-sd] median   max
Connect:        0    1   0.2      1       3
Processing:     0    2   0.4      2       7
Waiting:        0    1   0.4      1       7
Total:          0    3   0.4      3       9

Percentage of the requests served within a certain time (ms)
  50%      3
  66%      3
  75%      3
  80%      3
  90%      4
  95%      4
  98%      4
  99%      4
 100%      9 (longest request)
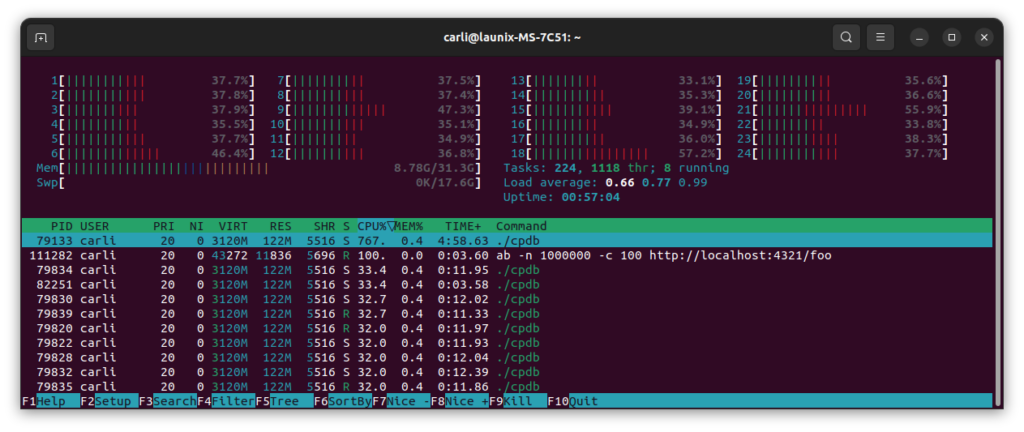
30,000 requests per second sounds really great, dosen’t it? But take a closer look at htop

As you can see, ab is a single core program. They assume that one CPU core can never generate so much load a web server couldn’t handle. They were proven wrong. While ab gasps at 100% CPU, memcp bores himself at 767% CPU load while it could take at least 2,300% 😉
Of course this benchmark does not cover the true memcps performance. For this, the following subsystems have to be implemented first and of course will drag performance further down:
- User/Request authentication
- SQL parsing
- SQL optimization
- JSON encoding of the results (in the moment, we do a simple string concatenation)
What it shows indeed is that you have to take measurement results with a grain of salt. Sometimes, it’s not the system that is wrong but your measurement method.
Comments are closed