Trigger Side-Effect Batching: 5x Speedup on Cascading Mutations
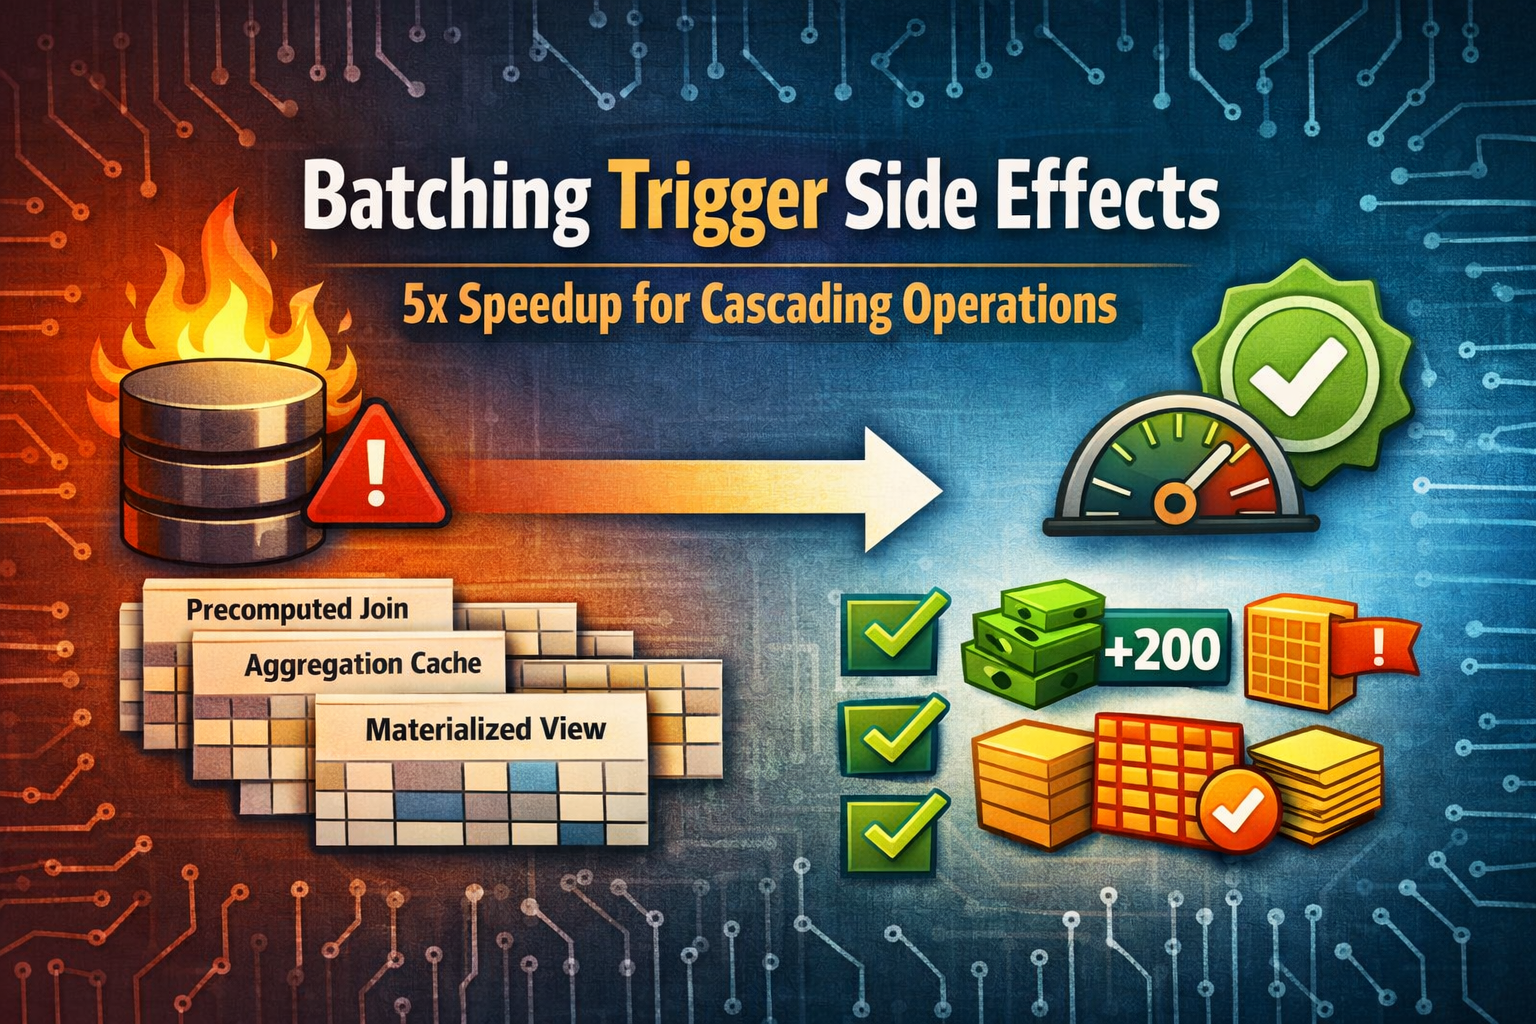
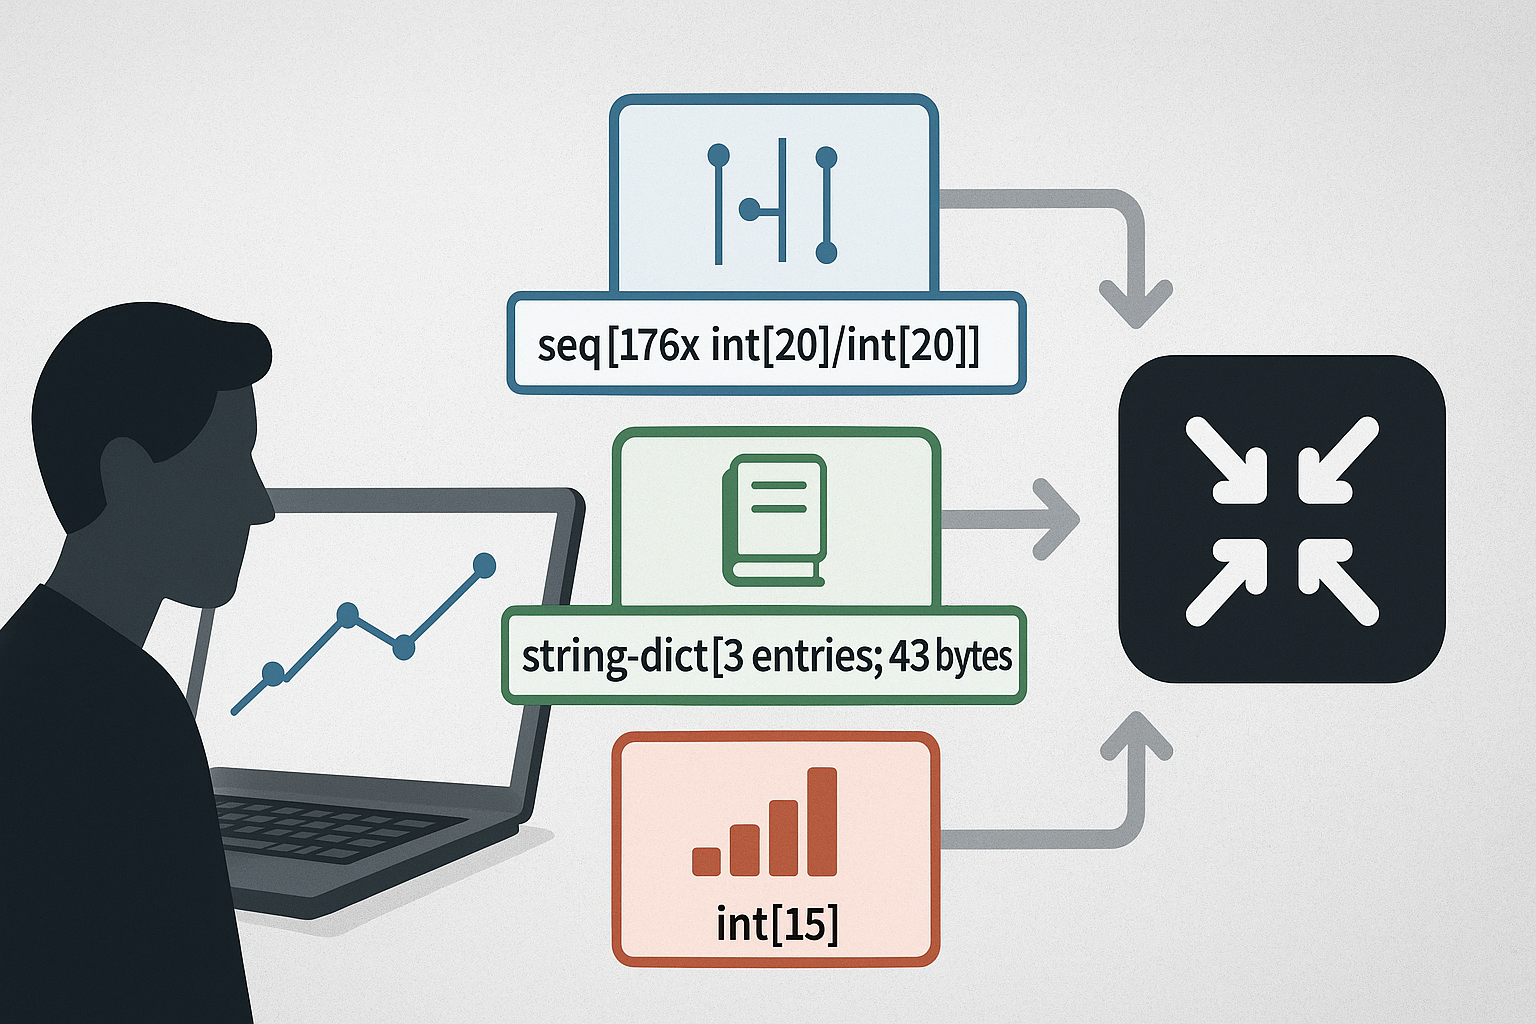
When a database maintains materialized views, aggregation caches, andjoin precomputation tables, a single DELETE can trigger hundreds ofcascading operations. We measured a single-row DELETE taking 1.6 secondson a modest cross-join (100 × 200 rows) — entirely due to trigger cascades. This post describes how we reduced that to 12 seconds for a full testsuite that…